Epson color restoration algorithm

For several years I’ve owned an Epson Perfection V370 Photo flatbed scanner, which I bought to, among other things, digitize my slide collection.

The Epson scanning software has a Color Restoration option that works surprisingly well.

The most interesting thing is that it does it automatically, simply by checking a box. The scanner is somewhat old, so it doesn’t use AI.

Here’s a fairly descriptive example.

The following image was taken with daylight-balanced slide film, but it was taken inside a church with artificial light.

Slide digitized without color restoration:

And this other image is of the same slide but with the color restoration option activated:

In my opinion, the result is, to say the least, surprising. The software has recovered the original color, clearly visible in the stone of the arches.

If anyone knows the algorithm that the Epson software uses, I’d like to know it, so I can implement it in my film digitization software.

Kind regards

1 Like

I have one of those Epson Perfection scanners (V600?) and have also been impressed by that one-click auto-color button in the past.

If you look at the before/after histograms, it tells a bit of the story:

All three channels end up distributed mostly across their whole range and are very similar in shape. I’m guessing this wouldn’t work well for images that are dominated by one color (or that are supposed to have a color cast), but in the average/general case of everyday photos it gives good results.

My guess is they auto-adjust the gamma/contrast/gain/etc. on one (all?) of the channels until they get the most even energy distribution, and then run Histogram Matching from that channel to the other two. That’s mostly just a guess, but it seems like that would always give you something like the above histogram transformation.

There’s almost certainly more steps/subtlety to it, but that might be a good starting point.

3 Likes

@npiegdon Thanks for your input. I hadn’t thought of doing such a simple test as comparing the histograms of both images.

Actually, color restoration, at least for “normal” images, should consist of expanding the histogram of the washed-out channel, in this case the blue channel, just as we do to manually restore the color of an old photograph using image editing software.

Certainly it seems to be more involved than a simple histogram alignment in RGB-space. Here’s the result of such a procedure:

Top-Left is the input image, Top-Right the desired goal image, and Lower-Left the image resulting from histogram-transformations in RGB-space. The transforms used here are displayed in the Lower-Right image.

The transformed image comes close to the reference image (Top-Right), but shows more saturated colors. Possible enhancements might be processing in another color space (HSV for example) or using localized processing instead of global processing as above.

2 Likes

Good to see the color gang still active in the forum.

@Manuel_Angel I have been experimenting with color chart imprinting (what I called synthetic color chart) and can share some insight.

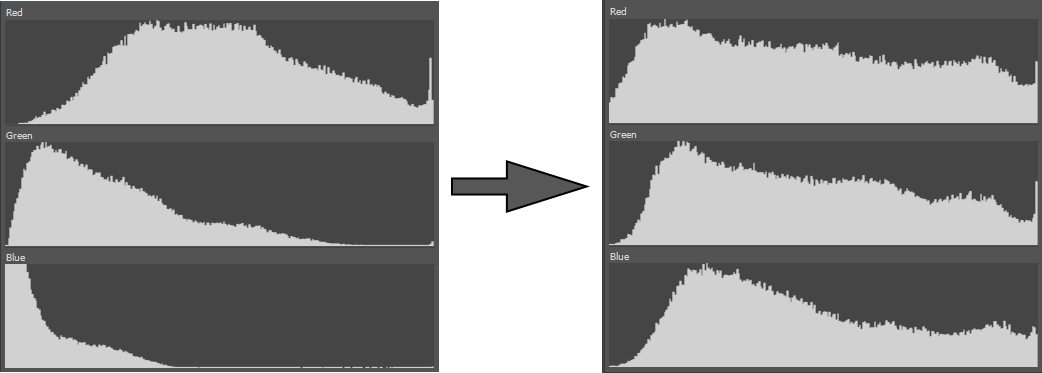
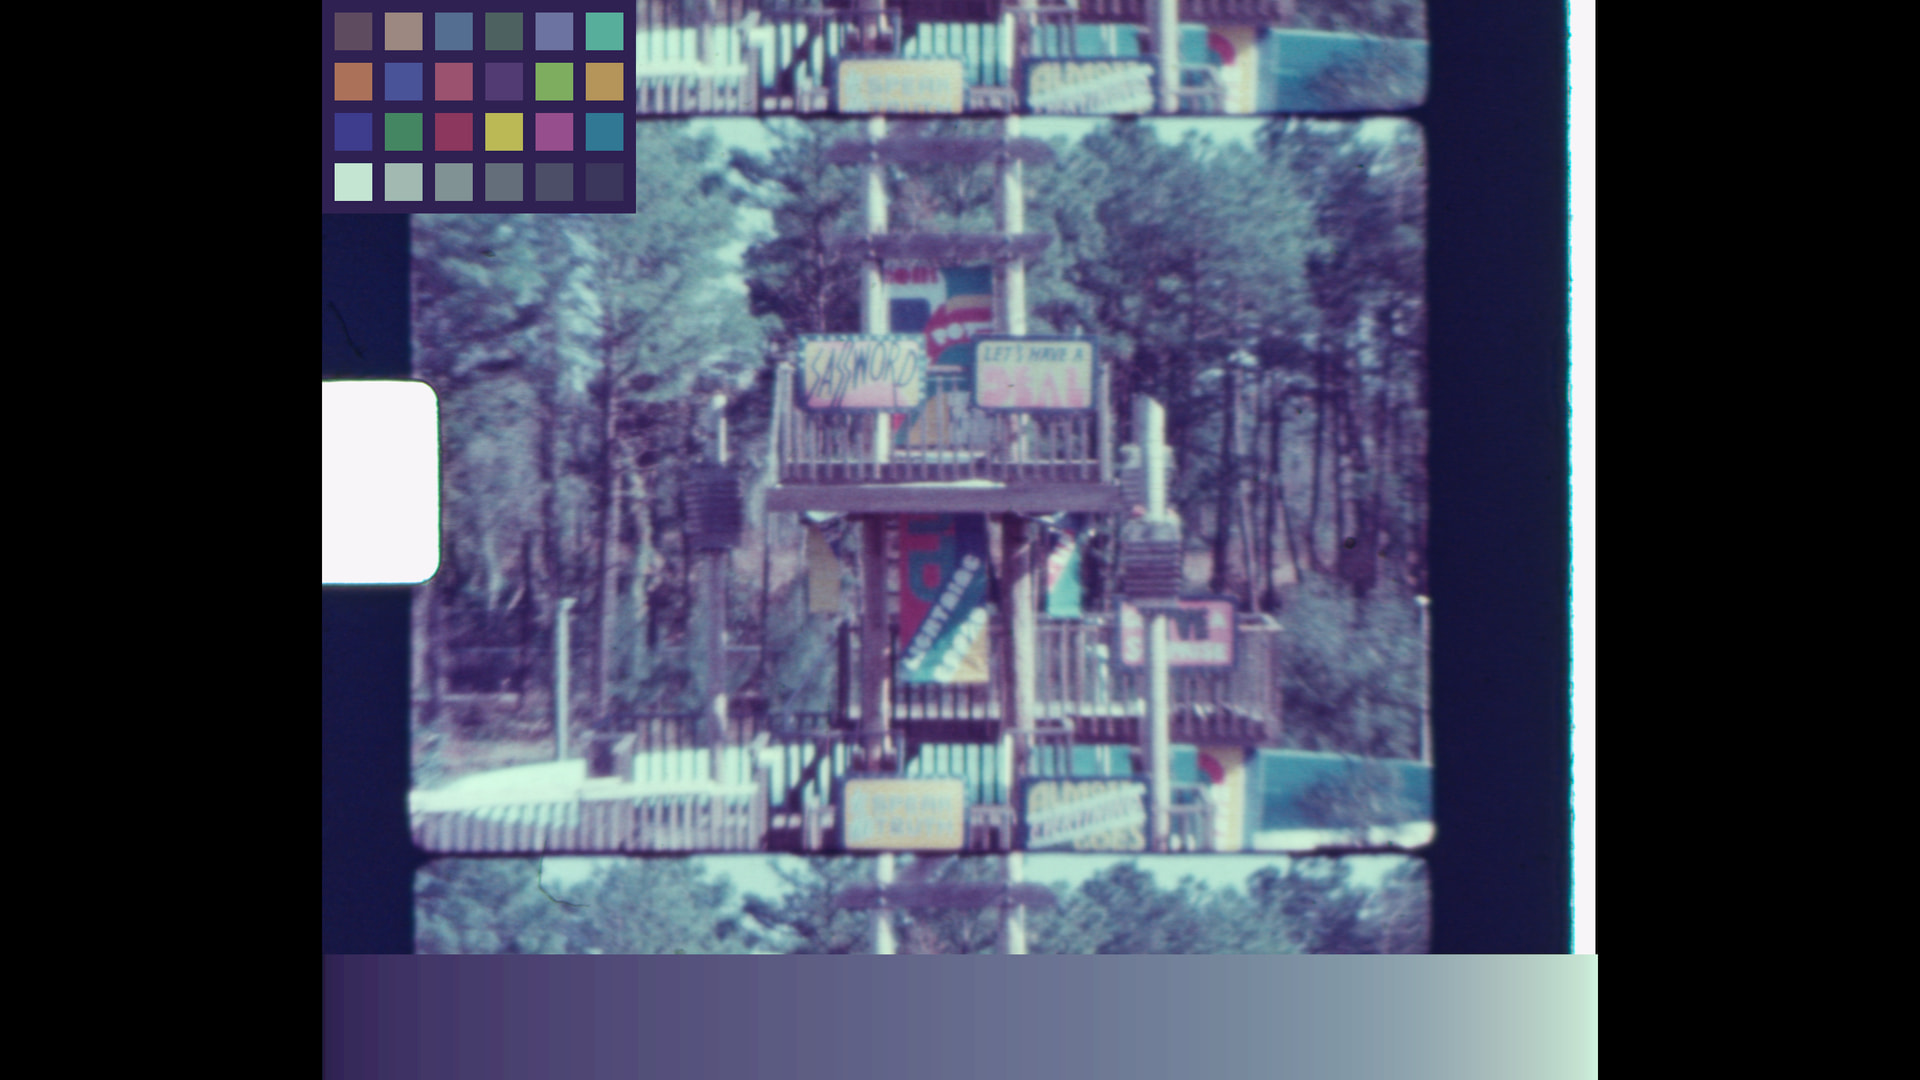
What I have done is to find the minimum and maximum for each color channel in the area of interest (aoi), and then use those values as the light in the scene to create a simulated color chart as it would have been illuminated with the primaries of light at the scene.

In selecting the aoi is important that there are no clip components (black or white), otherwise, the clip values would have matching/clipped RGB values and defeat the selection. Note that this method is not suitable for every scene, as it requires that there is some relevant near white and near black exposed areas.

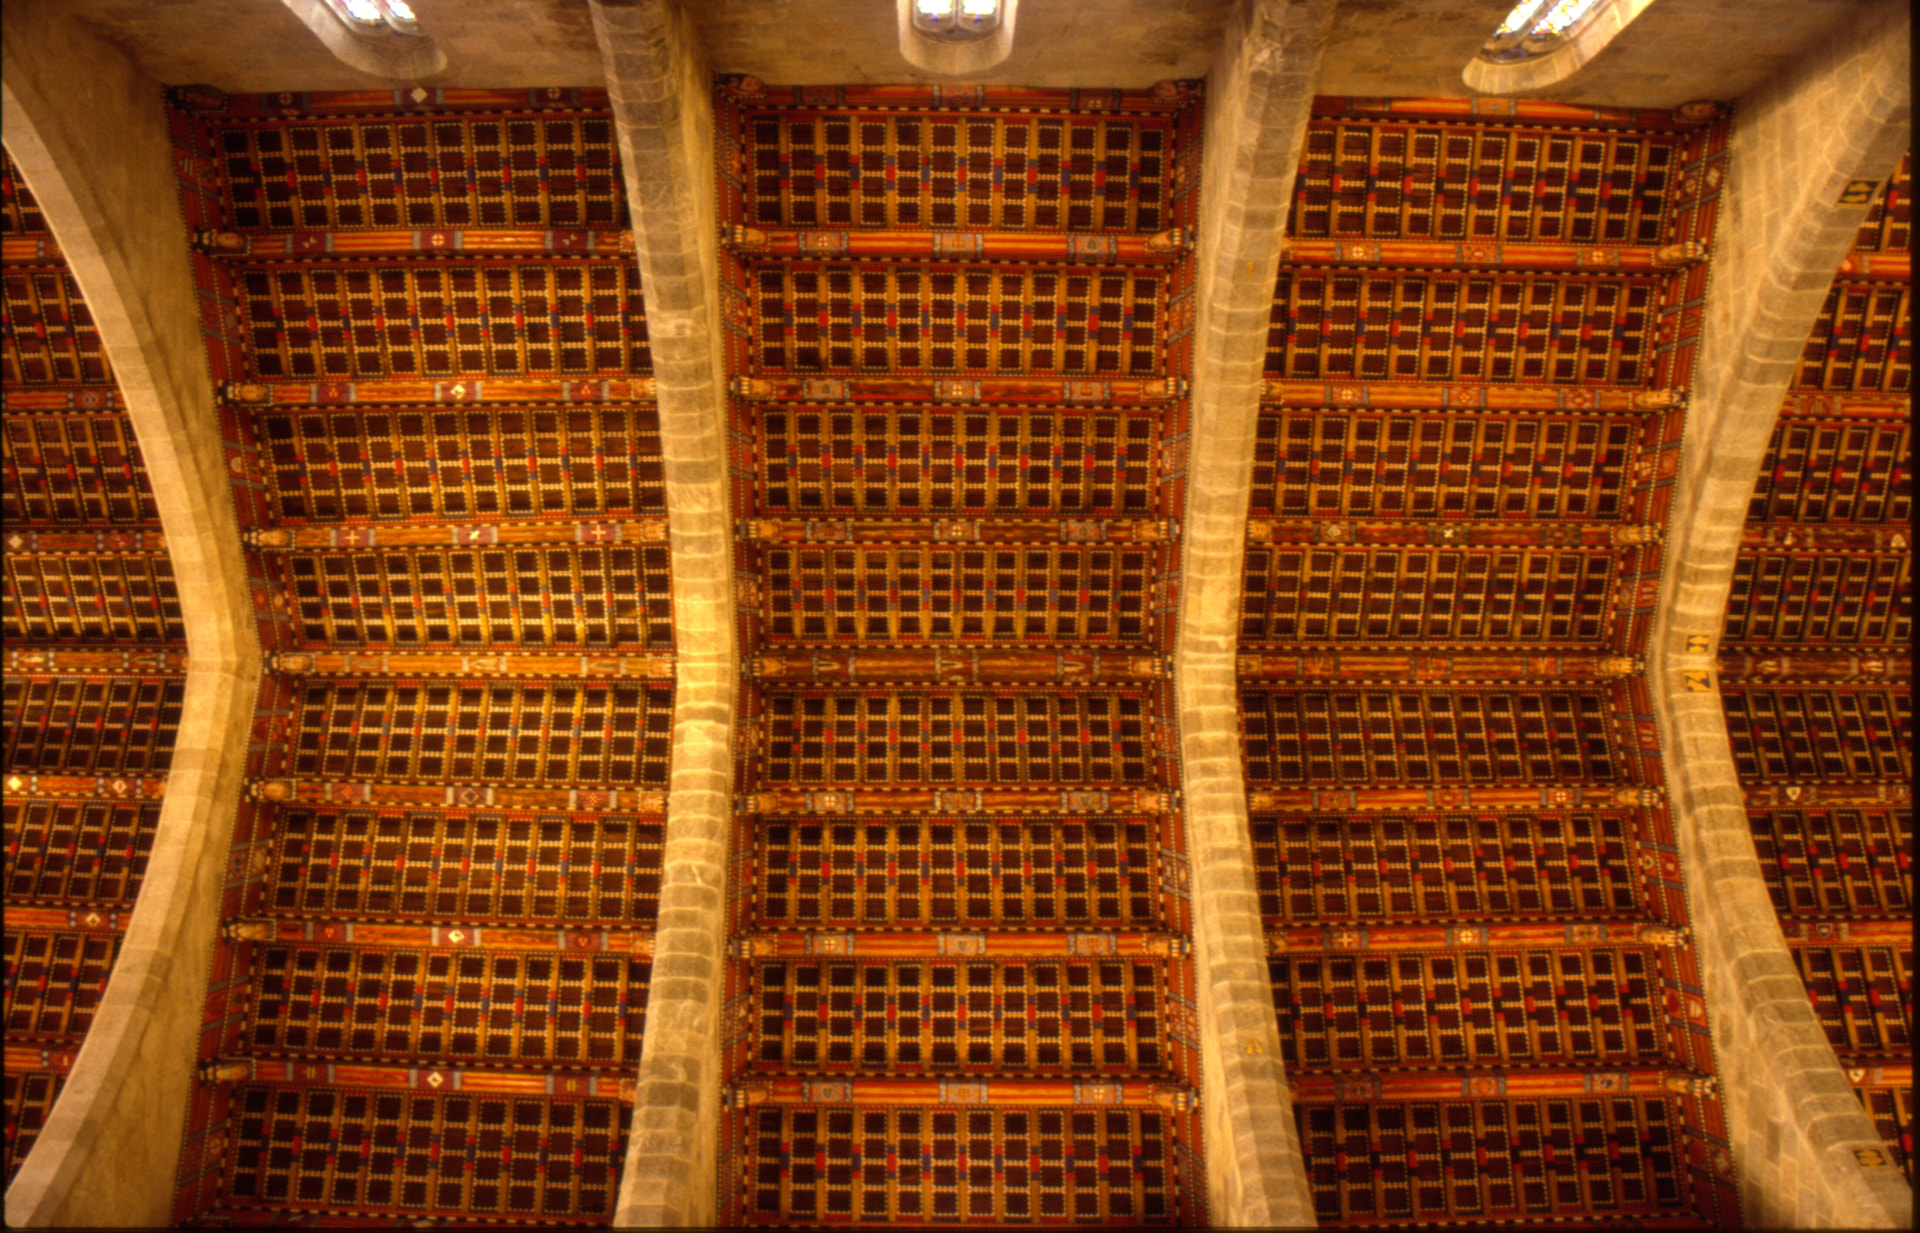
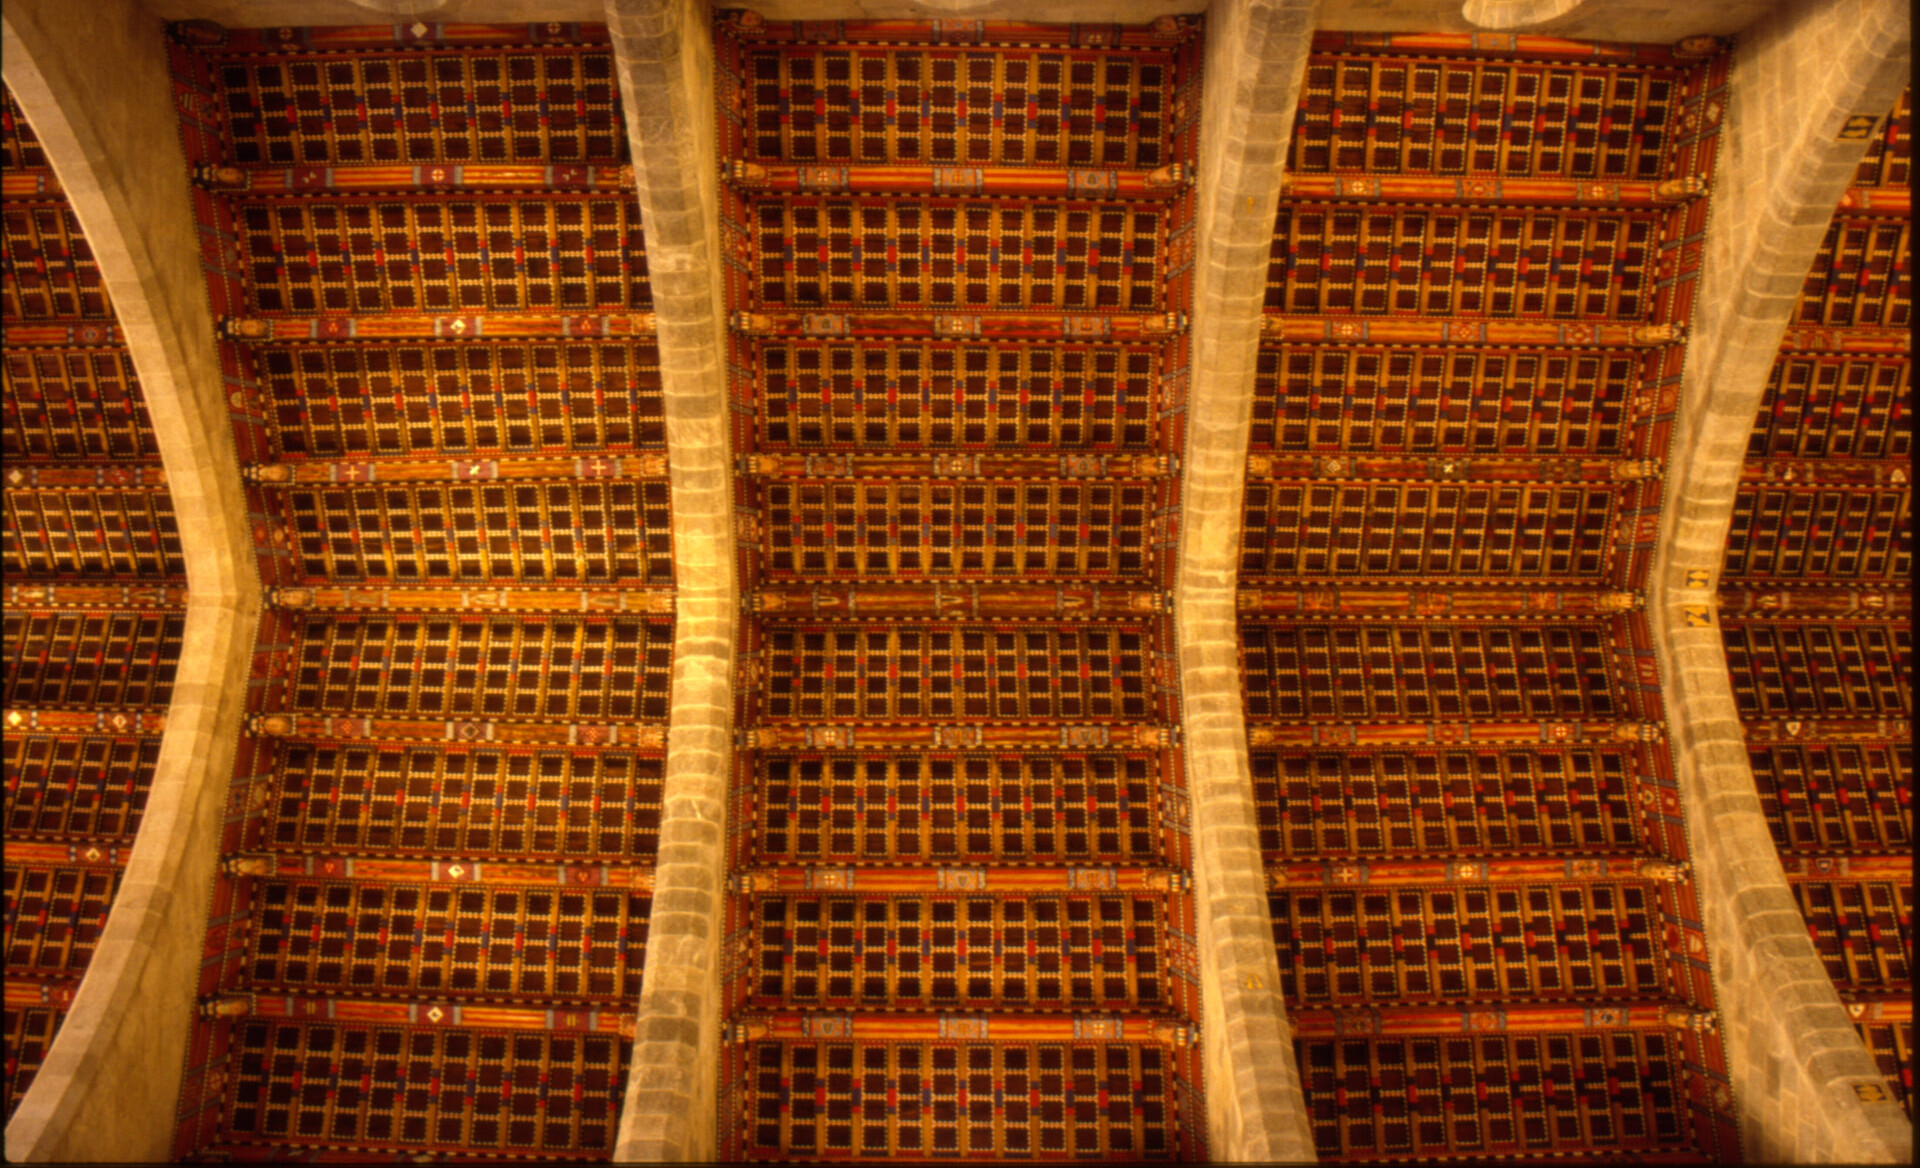
For your image, this is the area of interest chosen (excludes the windows):

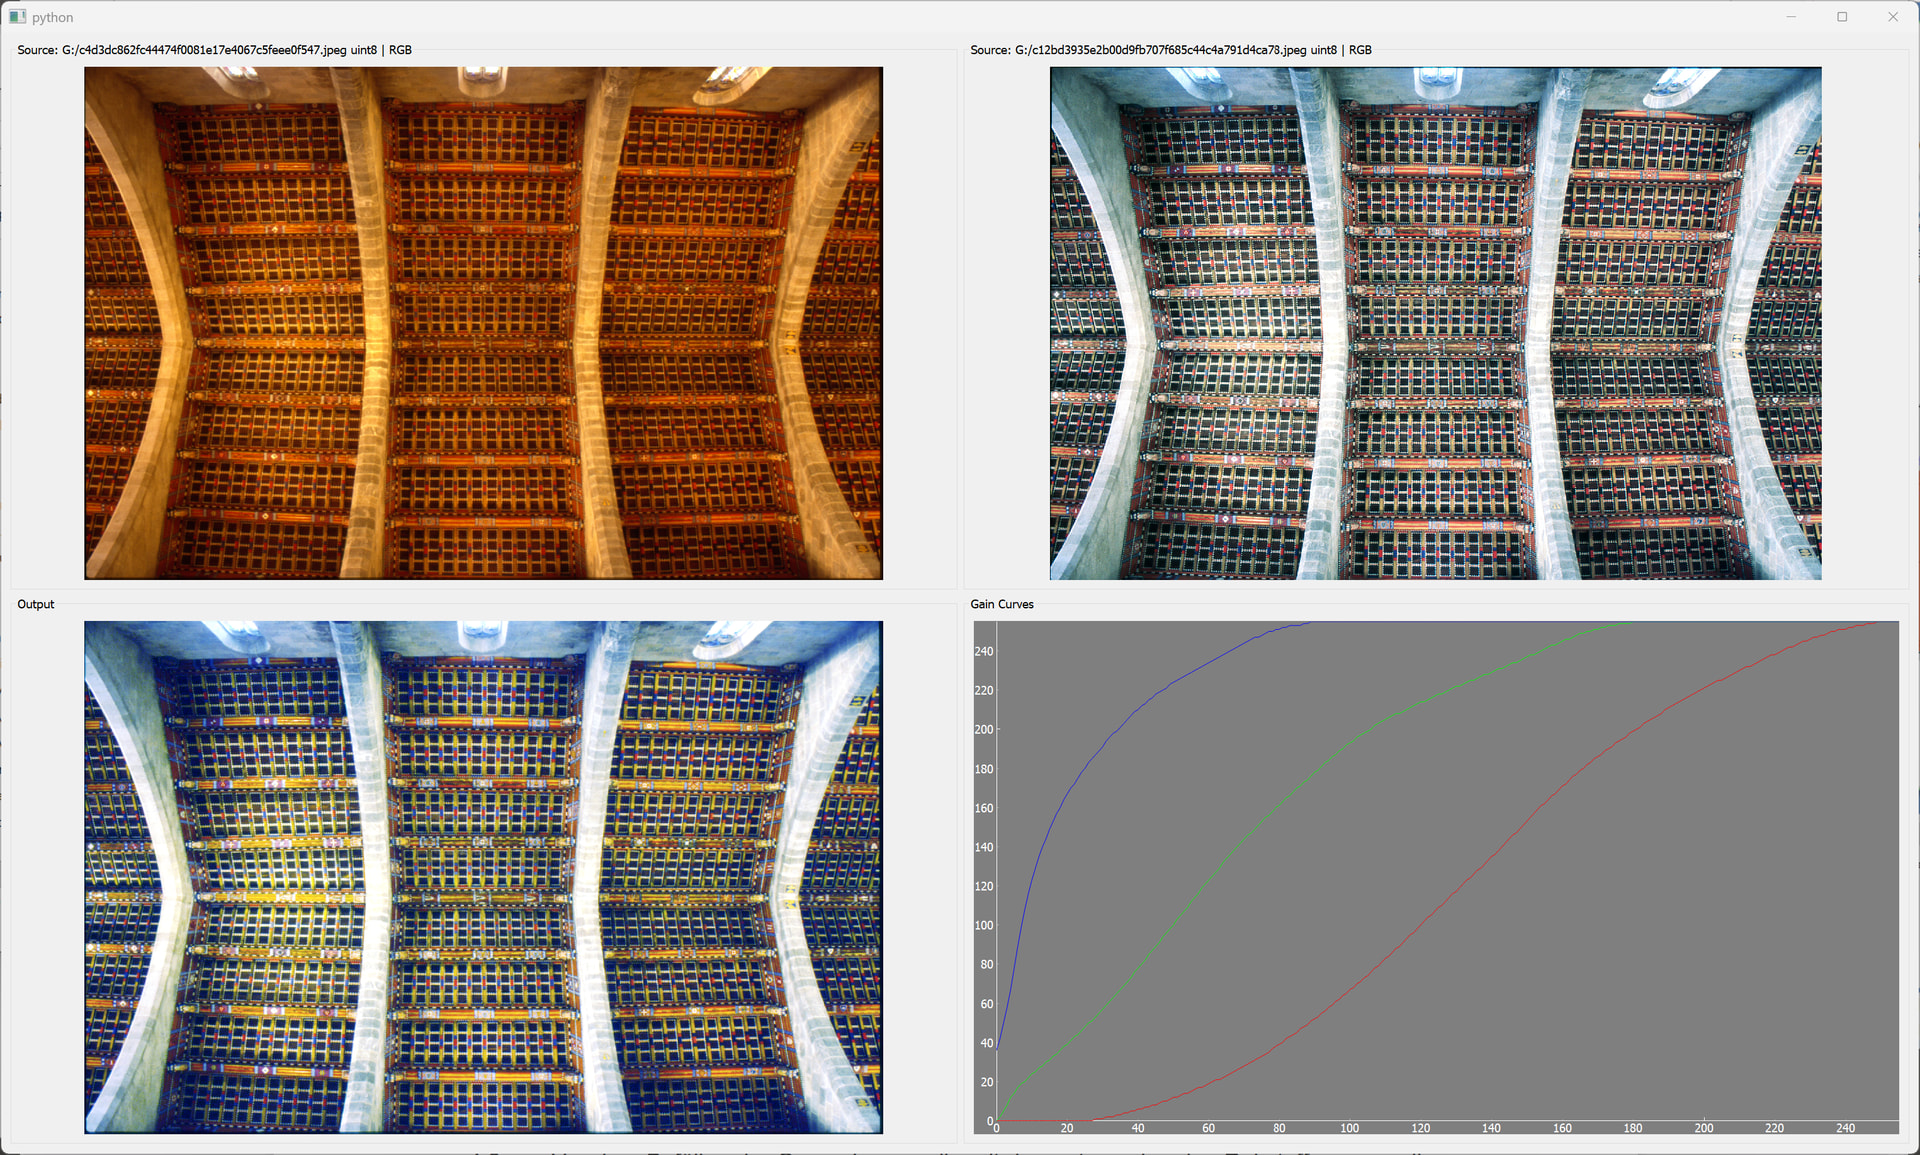
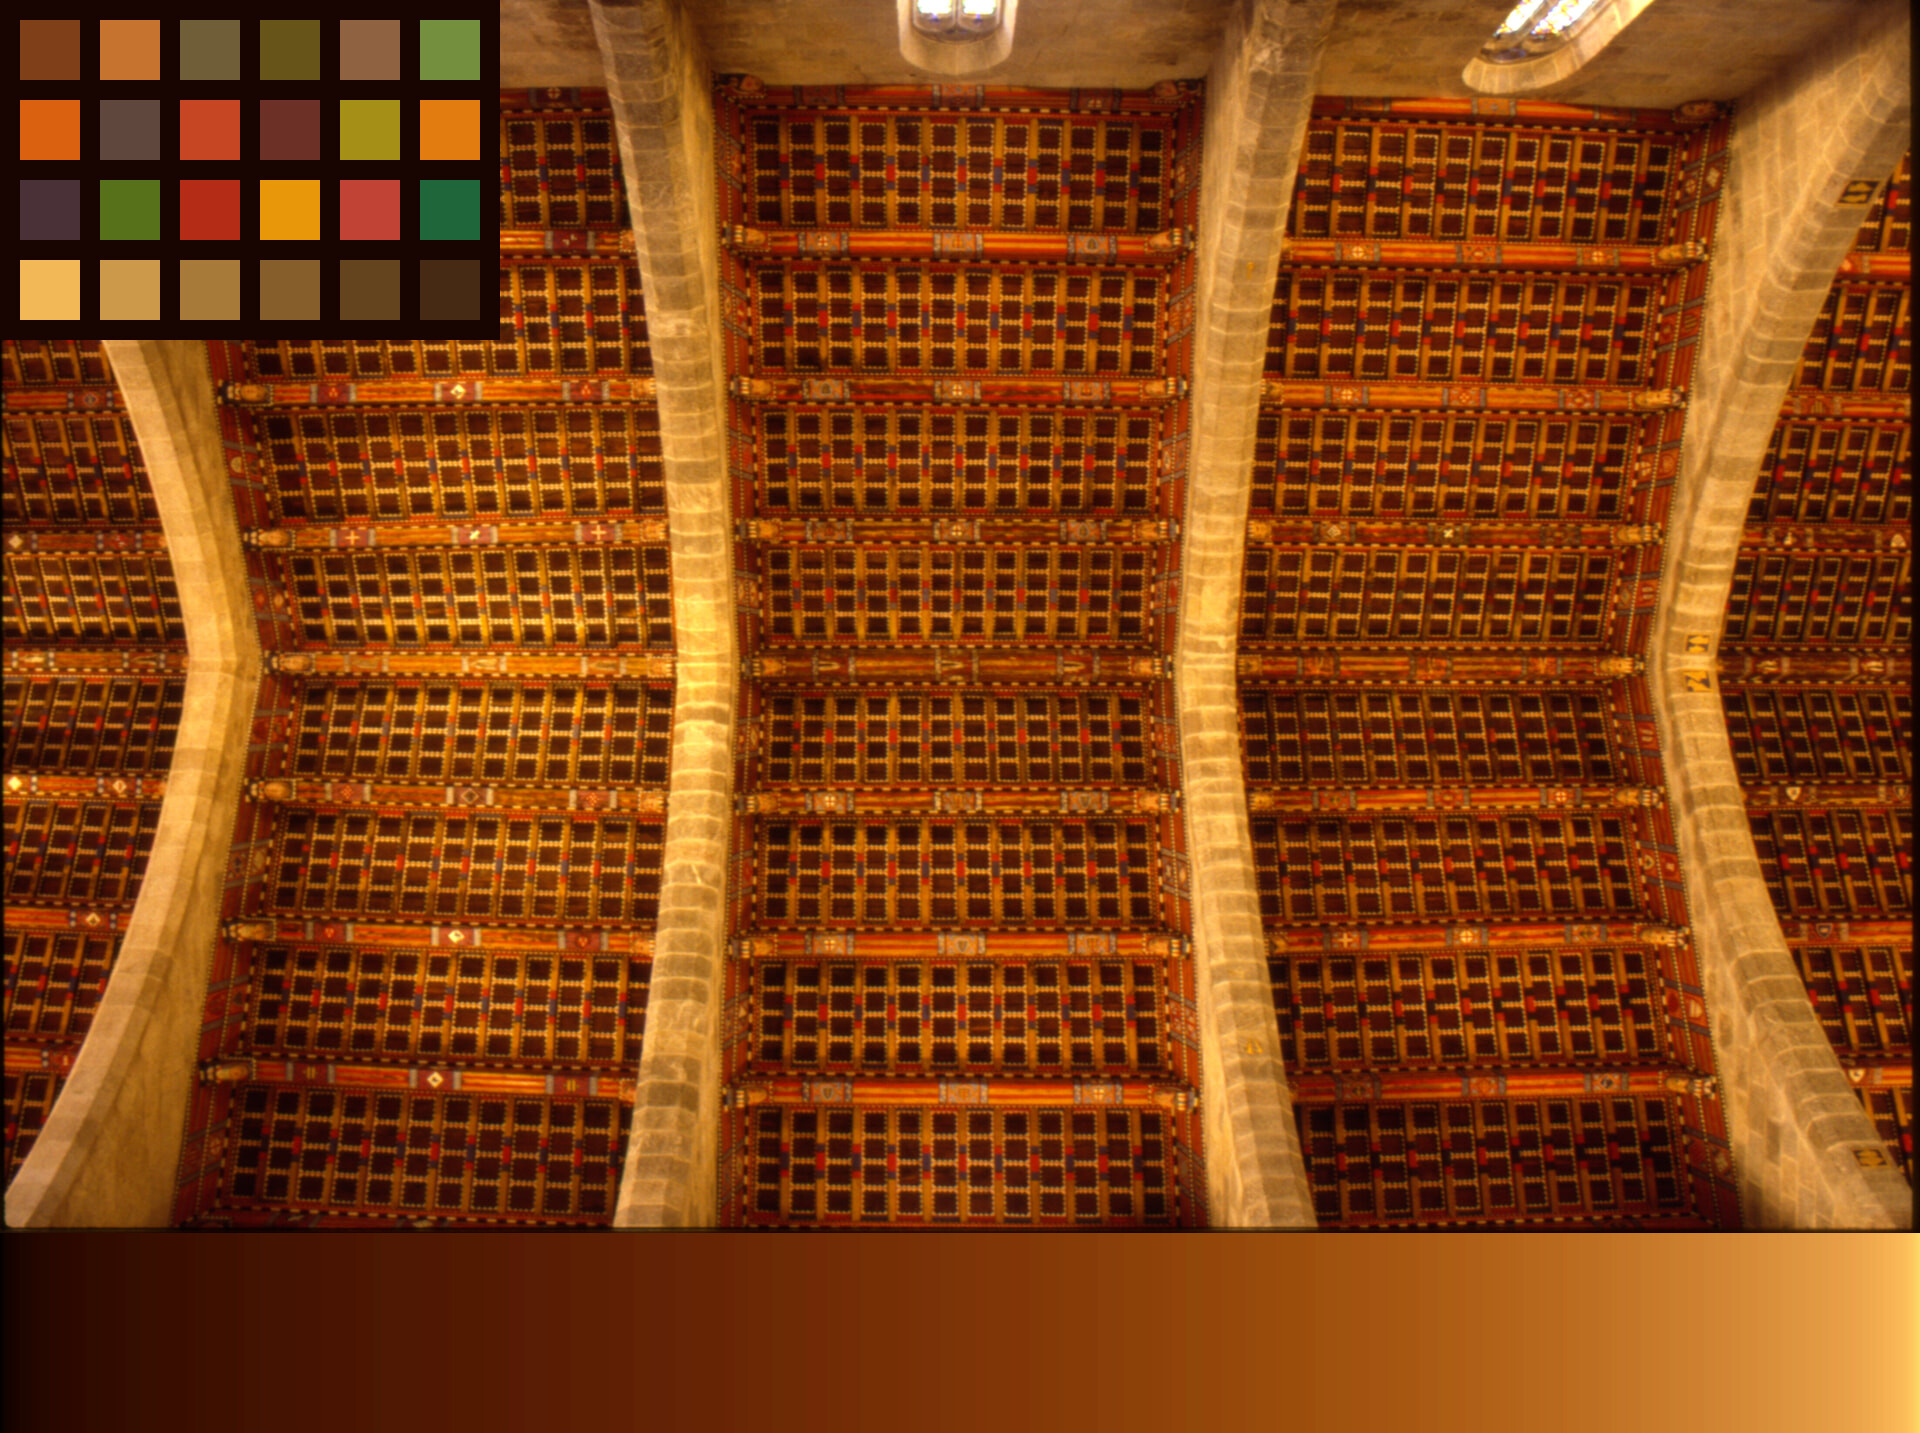
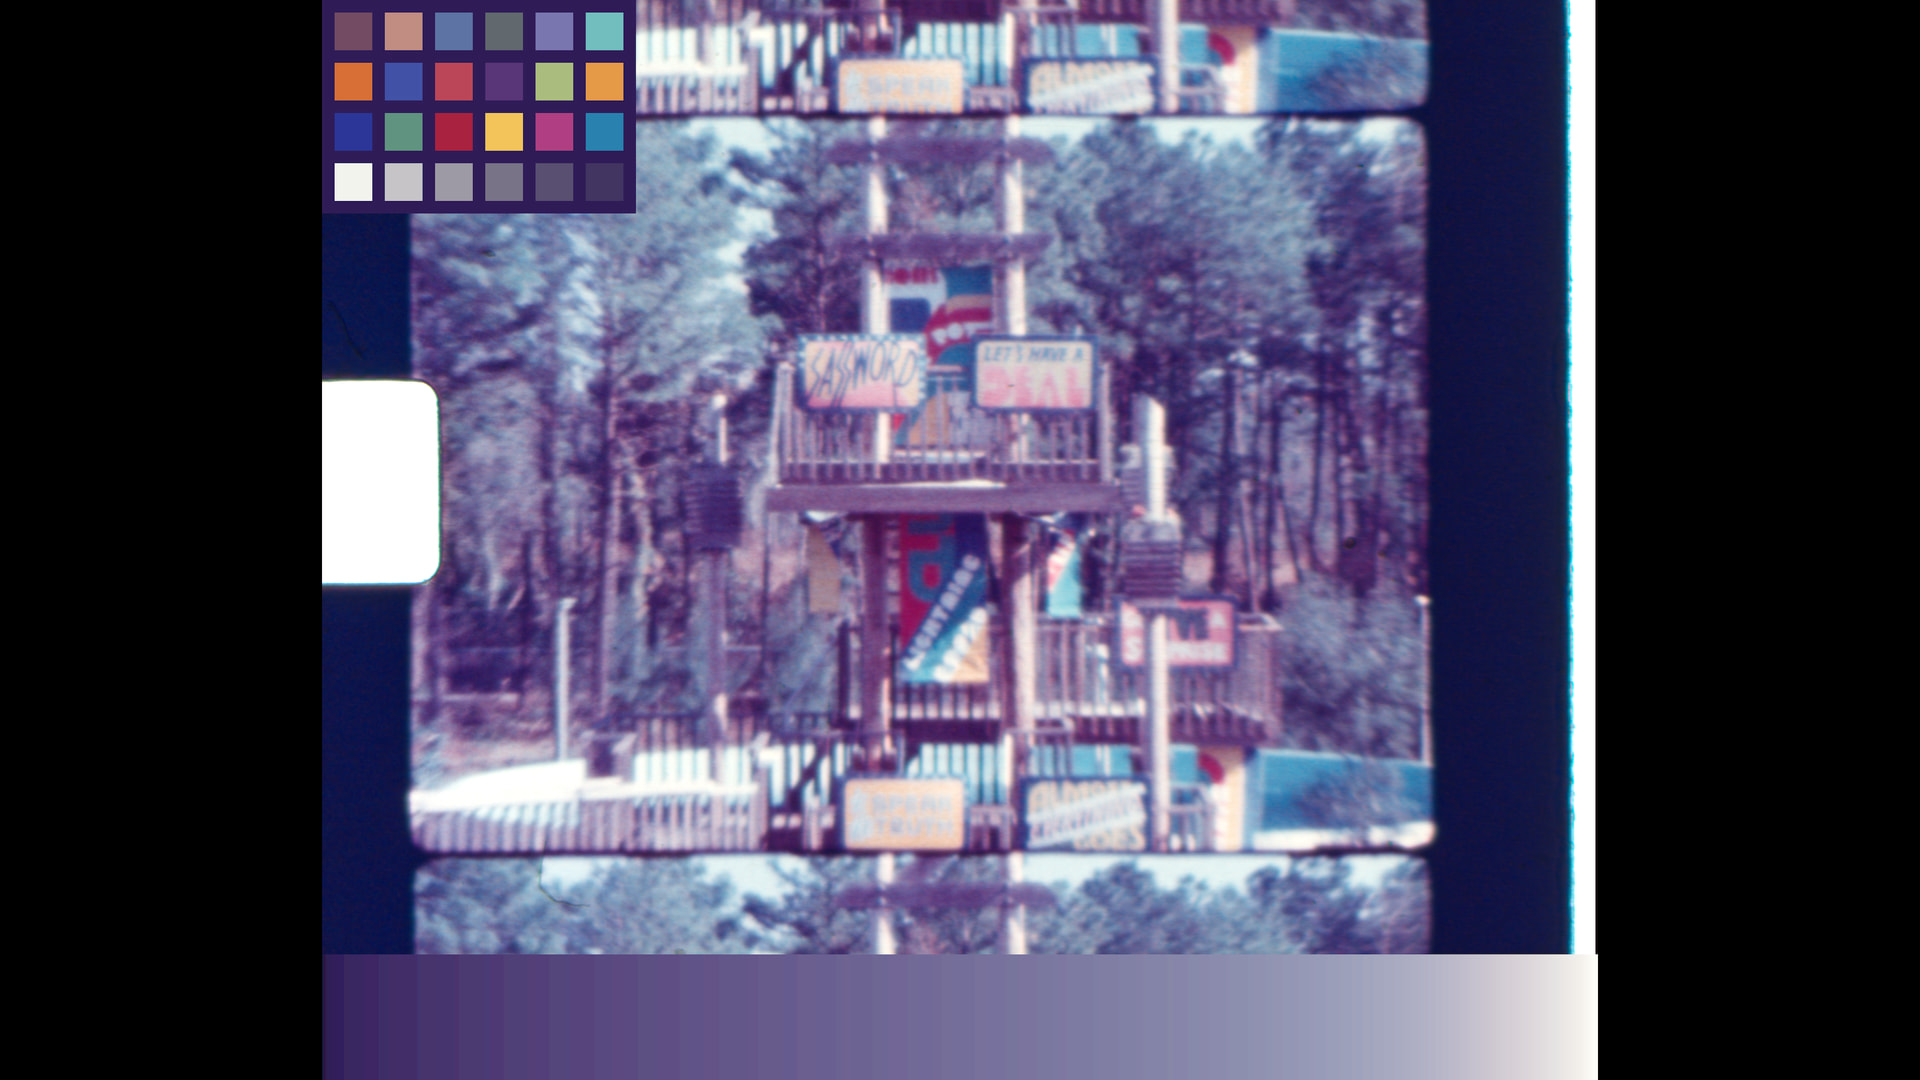
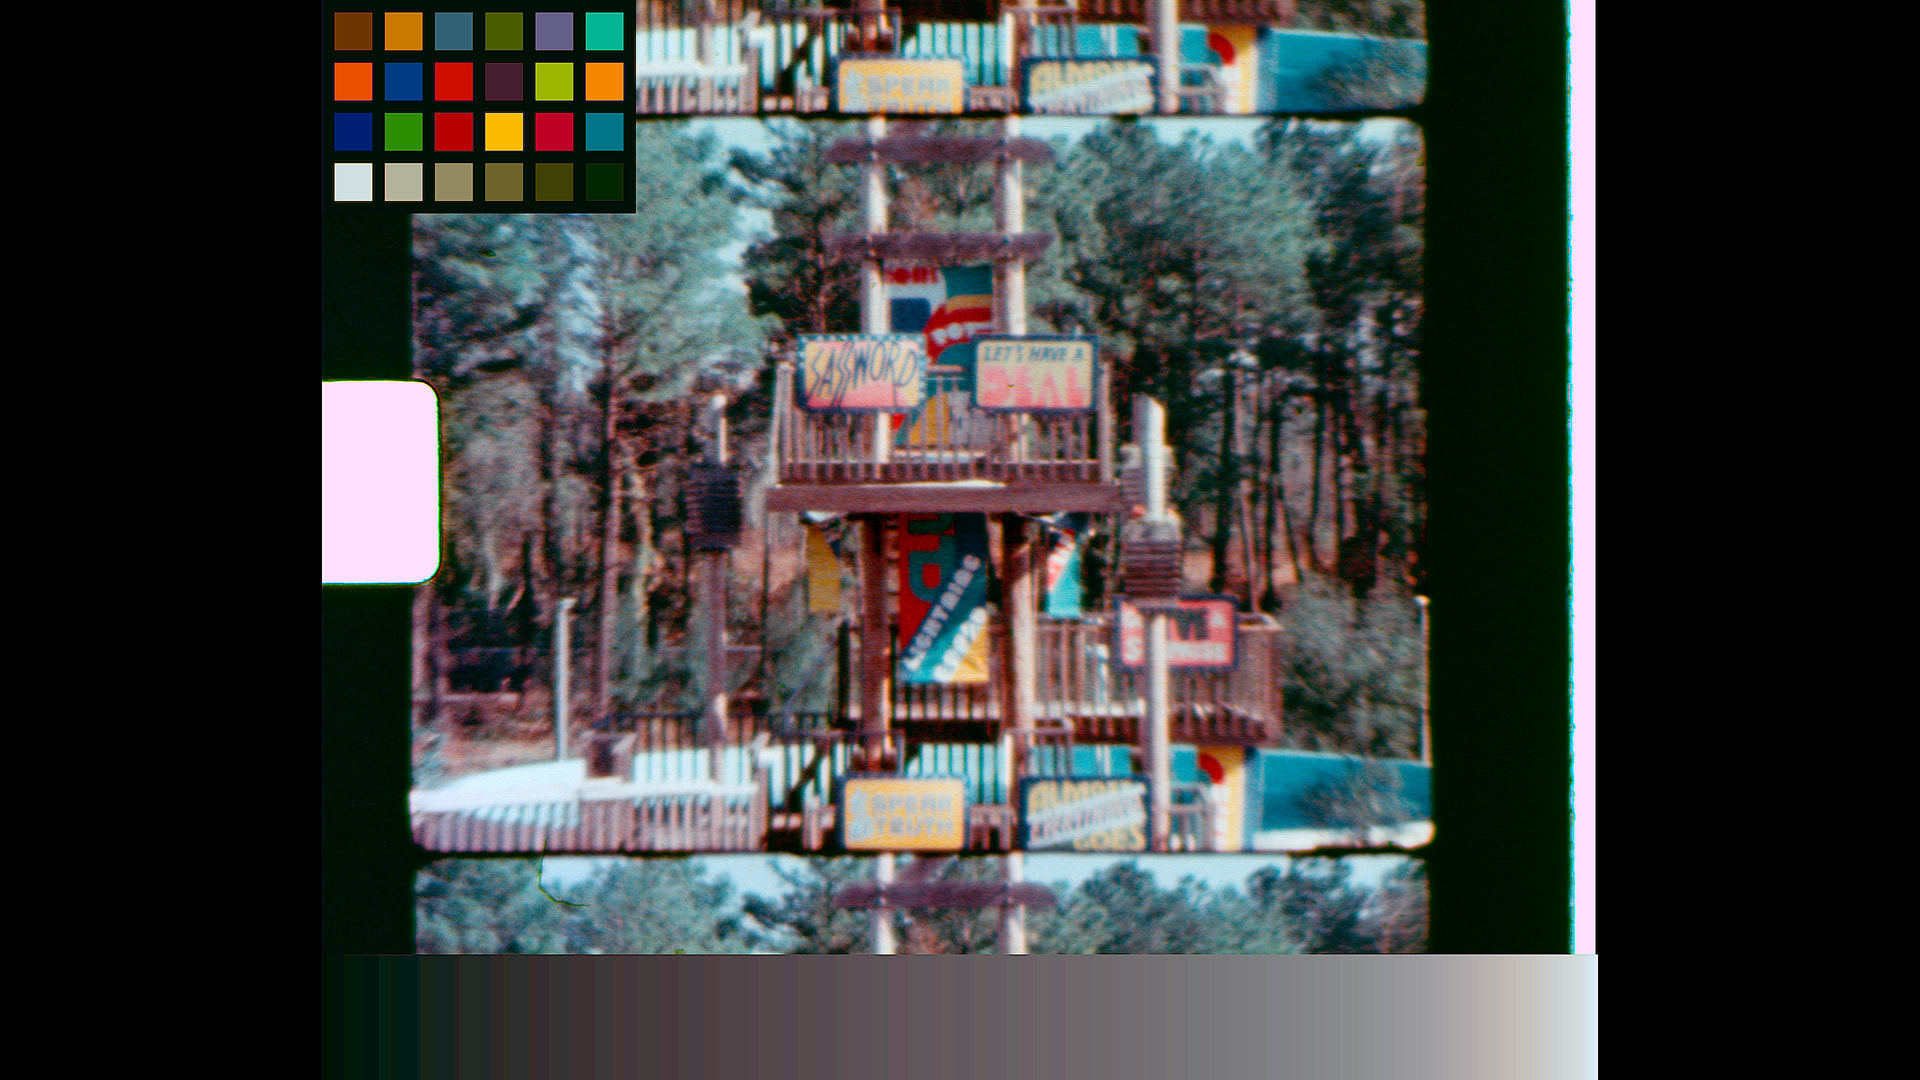
The resulting image with color target:

Note if the image is linear, the patches on the color target will be linear, if there is gamma, the values for the patches will not be linear (gamma), as in the above image.

In Davinci Resolve, I prefer to work on a linear gamma on the clips, and then at the timeline go from linear to whatever gamma/color space is needed for the output. For this test the timeline colorspace is sRGB.

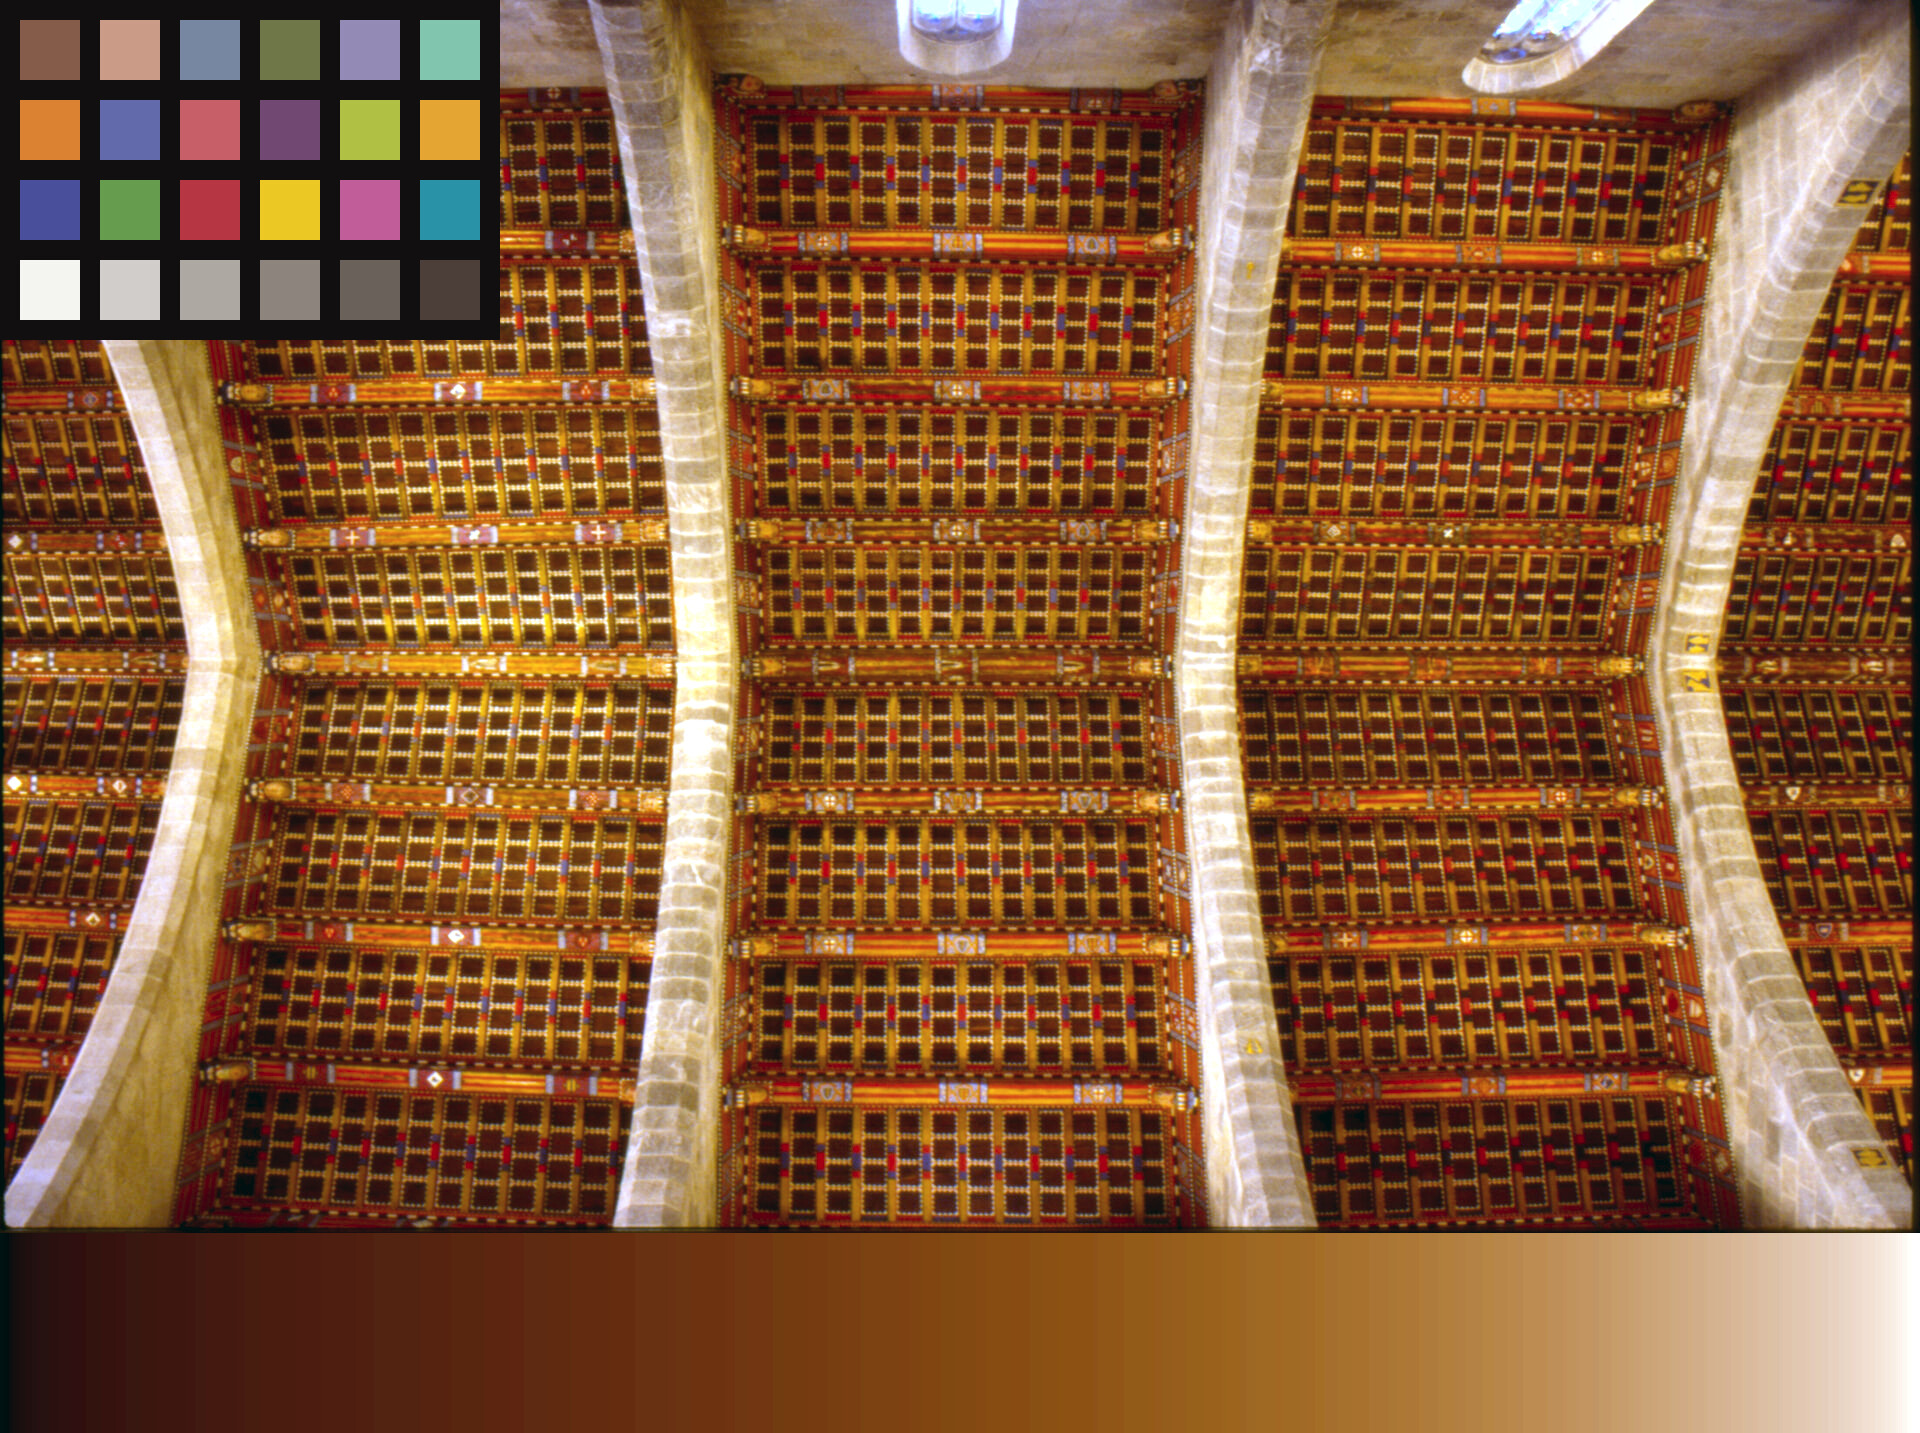
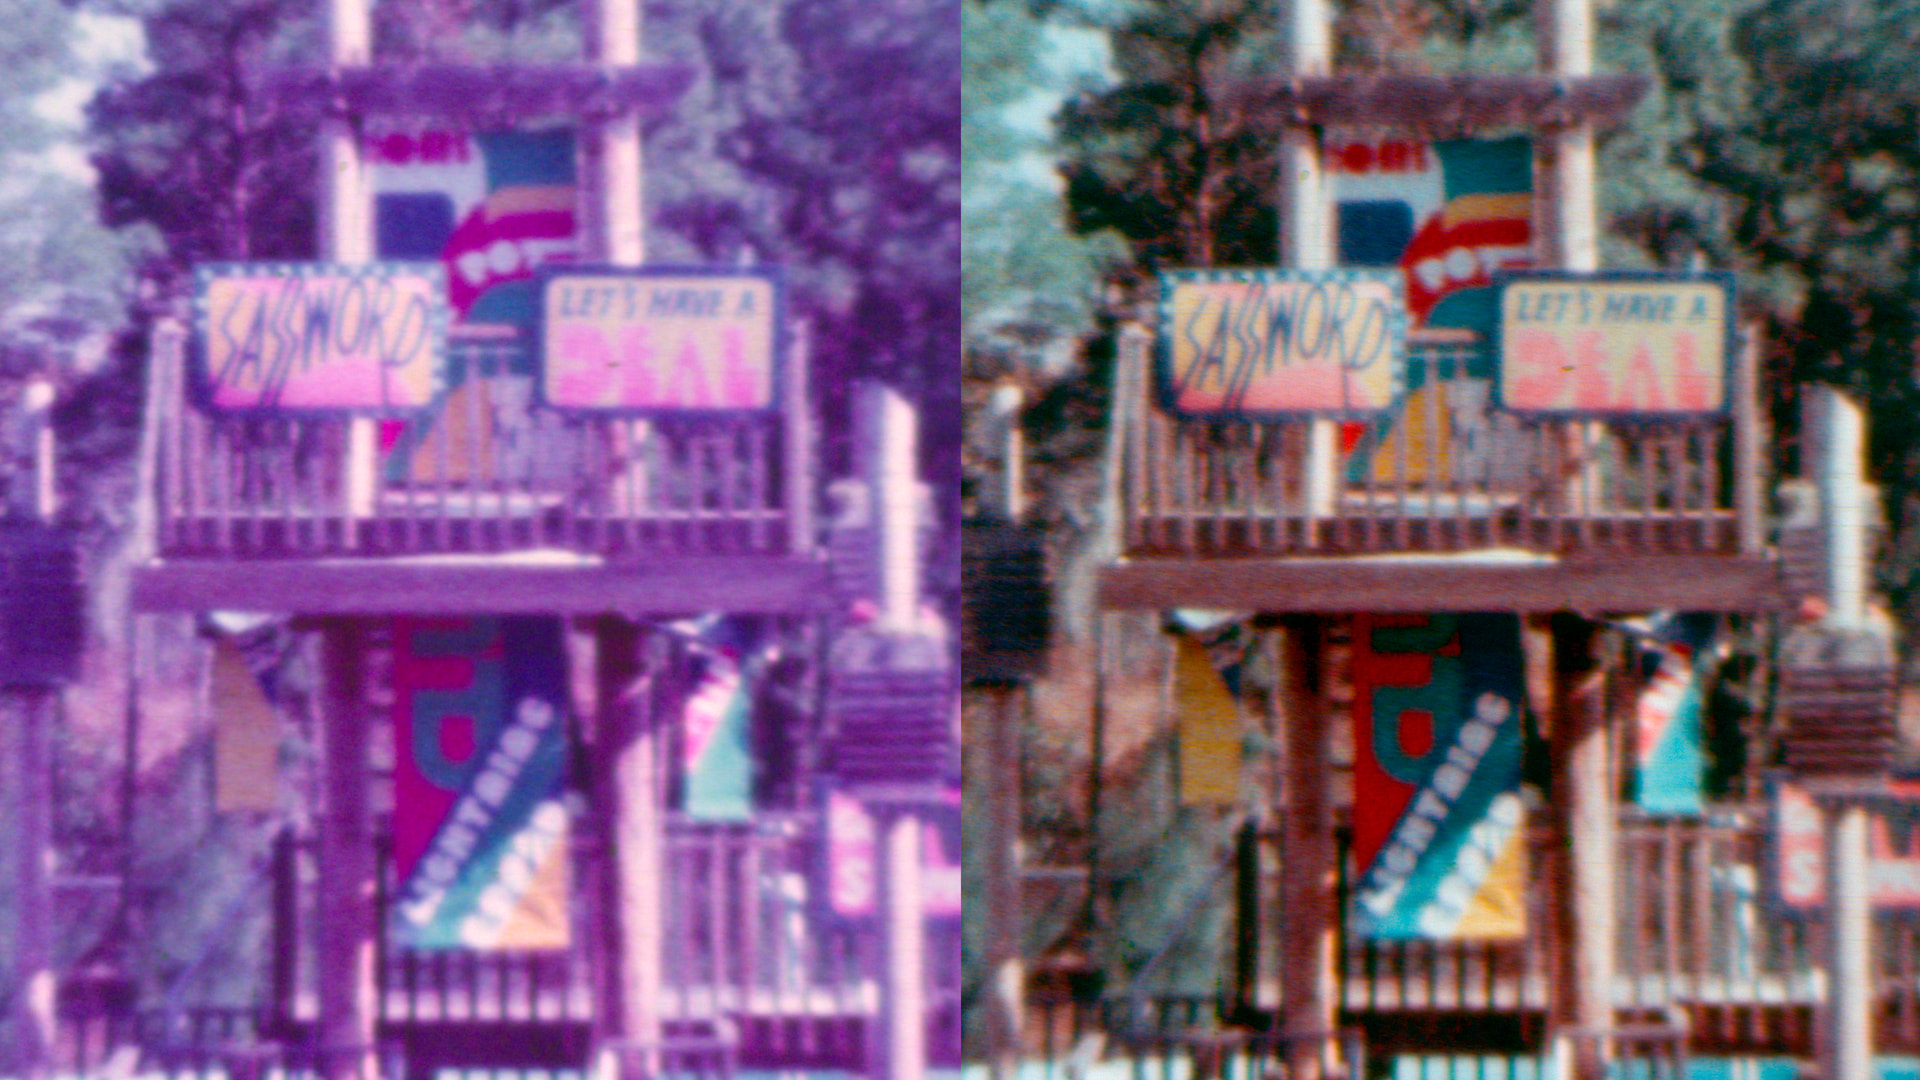
Since the image posted is not linear, a first clip-node with color space transform (CST) was used at the clip to go from sRGB Gamma 2.4 to sRGB Linear. The second clip-node uses the imprinted color chart for the color match. Nothing else was done for the test, normally one would have a third clip-node to adjust for color correction/taste.

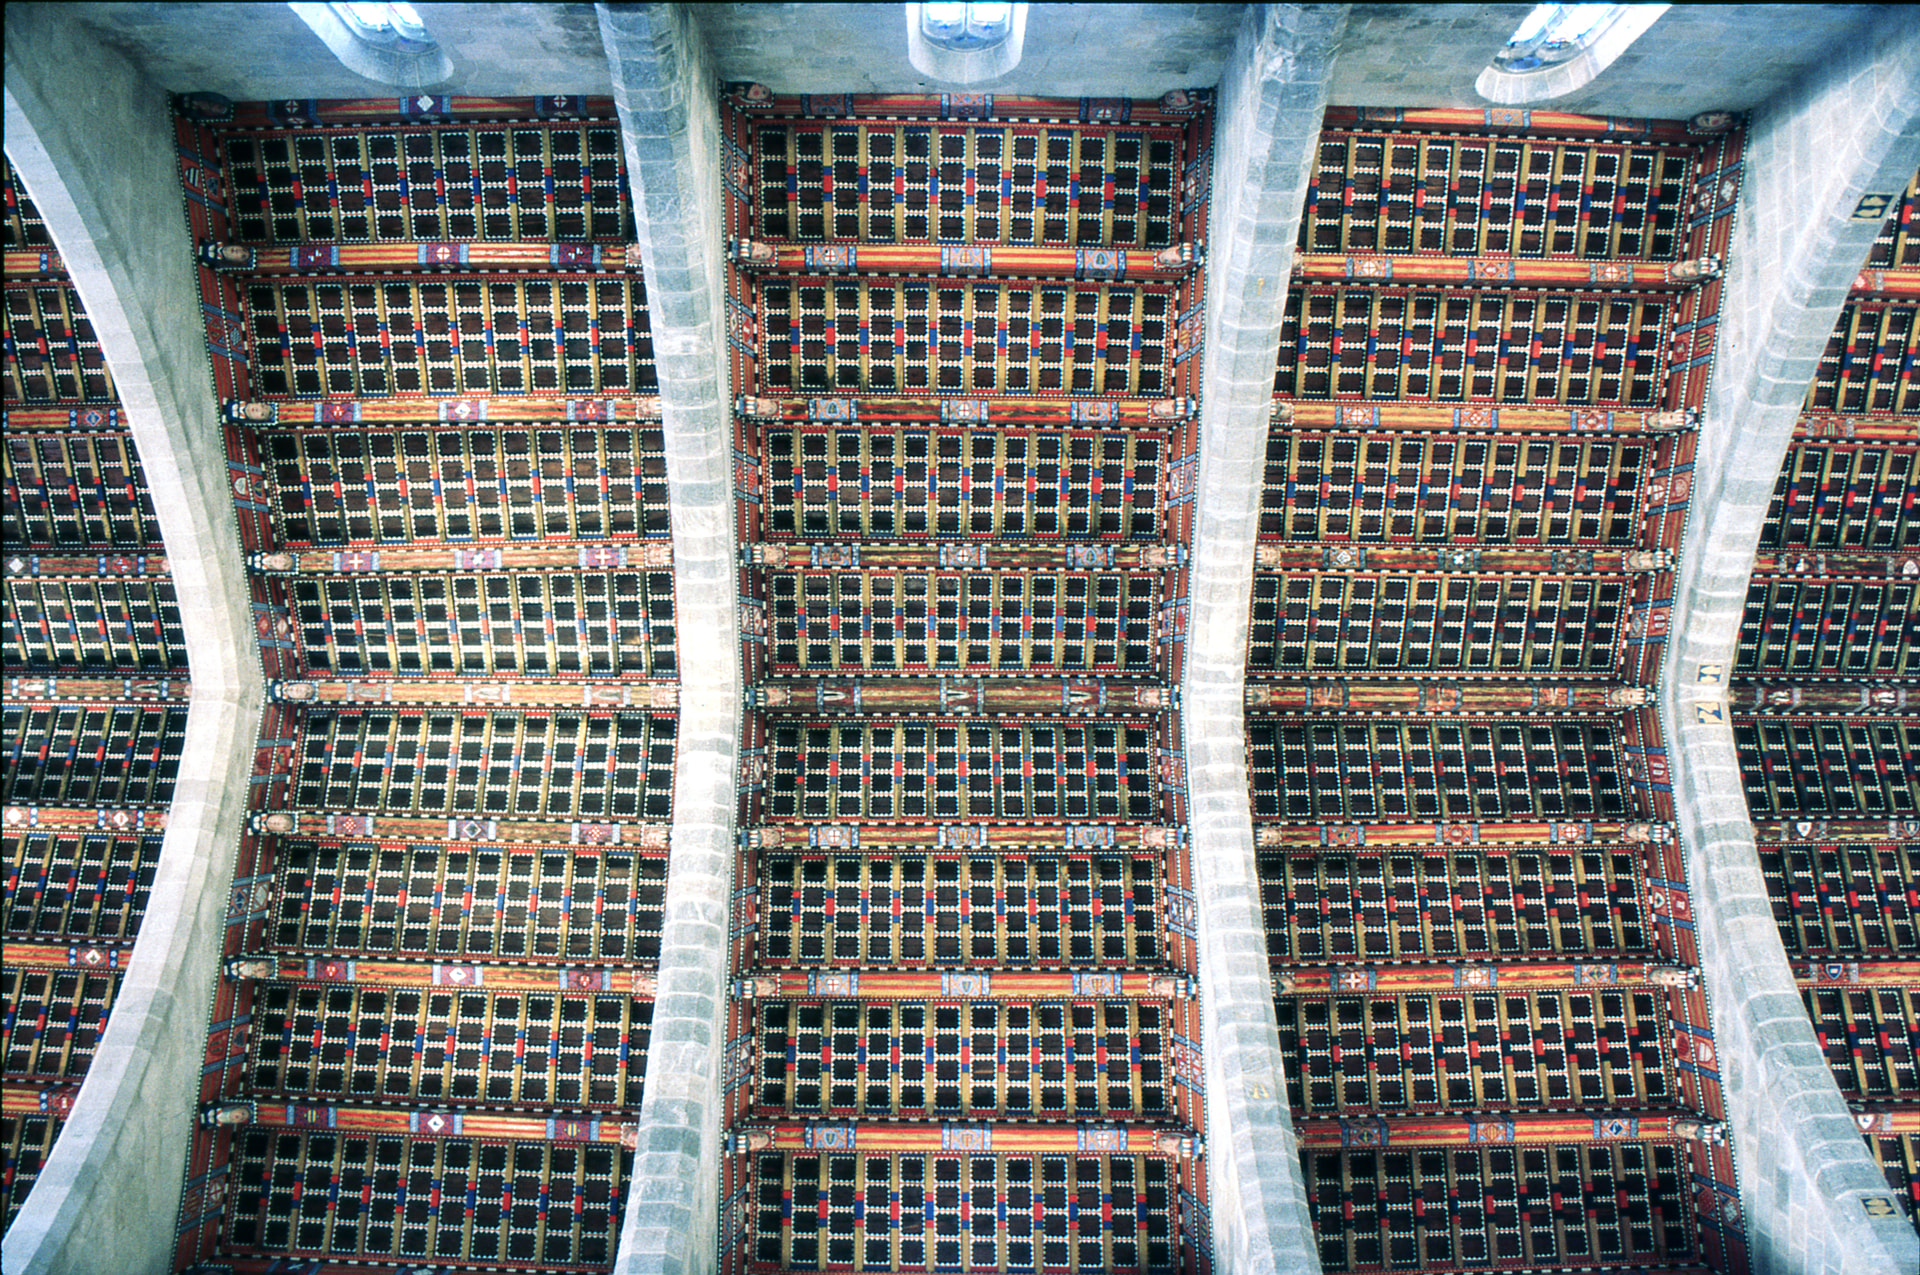
The image resulting from the color chart correction, in my opinion, is more natural (even without any taste correction). I think the results of the Epson Color Restoration algorithm for this particular image somewhat distort the color of -what I believe is- the wood trim around the colors of the ceiling.

If I understand correctly, all the color chart does is to adjust the RGB component start-end (Rmin/max Gmin/max Bmin/max). However, doing so at scanning (at 8 bit or 12 bit) would not produce smooth results. For that reason, I chose to use this tool during color correction, especially since this method would also aid in color correction of unbalanced content color (not just faded film).

1 Like

@PM490 I’m very grateful for the tests you’ve performed and the explanation of the method you used.

I have to admit that I didn’t quite understand the procedure you employed, but in any case, the results you obtained are certainly more realistic than those offered by the Epson algorithm.

The original, uncorrected image suffers from a strong cast due to the lack of blue in the ambient light at the time of capture.

Looking at the image corrected by the algorithm, the opposite effect is evident: there’s an excess of blue, hence the gray color of the stone in the pointed arches.

The procedure you applied does indeed give a more natural color to the stone arches and, therefore, I believe, to the entire image.

Perhaps I got carried away by enthusiasm upon seeing such a radical change in the image simply by activating one option.

Kind regards

1 Like

Yeah, your synthetic color chart idea continues to impress me. Those results are easily better than Epson’s.

It also has the benefit of being pretty straightforward to implement with minimal fancy math/mental gymnastics.

Nice work!

1 Like

Thank you for the kind comments @Manuel_Angel @npiegdon

I have not posted much on the progress of snailscan2, but real progress is in the works. One of the areas I have been testing is capturing the full range of each color, alike what one would do with a monochrome sensor and RGB leds, but instead using a color sensor (the color bayer filter) and white led.

Here is a recent test, on the context of using the color target, and working with faded films & white LED.

HQ DNG Developed by Resolve (how the film actually looks)

HQ Separate Color Channel Capture Binning to Half Resolution with 16 Stacking

Color Target Match

After Color Correction

Left: DNG Full Resolution - Right: Separate Color Channel Capture Half Resolution

In the trade off time-quality-budget, it is appropriate to disclose that the capture is quite slow (time), as each color channel is capture and stacked separately with its own exposure settings (16 captures per channel and binning). The quality on the test is half the HQ resolution (binning), but with 16bit color depth (stacking). And the budget is unbeatable at the HQ cost. The color chart trick makes color correcting the per-channel-capture significantly less time consuming, with a final adjustment for color correction at the end.

I hope to share more information on the capture software, and the overall progress of the scanner, this winter.

2 Likes

I like that workflow a lot. My own coarse color pre-processing involves an interesting step that might work well in tandem with your idea:

One of my frustrations with color correction in video editing software like DaVinci is that–despite having access to some excellent scopes and histograms–you can only see that information for the current frame. Maybe that frame has some “interesting” blues, but a few seconds before there was a wider range available to scrutinize in the reds, etc. All of these automatic processes get better with more data but we can only see a tiny sliver of that data at a time. (I also prefer Photoshop’s “auto-color” and “auto-tone” features to DaVinci’s mostly-broken automatic color. It seems to get the footage into the right ballpark more reliably than the latter.)

So, I came up with the idea of a kind of “mega histogram”. I start by building a mosaic out of a representative sample of frames. The thumbnails are something like an 80% center crop to make sure any sprocket hole or vignetting isn’t present. The mosaic isn’t built out of all the frames in a reel. Instead, I describe different “environments” in a little sidecar text file. If a reel jumps between indoor and outdoor footage several times, there would only be two environments. I’d specify the frame ranges something like this:

1-467 1092-2663 277  # indoor
468-1091 2664-3652   # outdoor

When that is run through my little mosaic tool, it would generate two output TIFFs with a selection of thumbnails equally spaced throughout those frame ranges. It adds a plain Hald LUT to the side of the mosaic. That trailing “277” on the first line looks like a repeat that would have already been included in the “1-467” frame range, but by calling a single frame out specifically (maybe it was an especially bright frame, a camera flash went off, or a similar single-frame event of interest) it will be forced into the mosaic instead of possibly being skipped.

Mega-Histogram Mosaic Example (3.3 MB as an 8-bit JPG; the 16-bit TIFF is 108 MB!)

With these giant TIFFs in Photoshop I can use adjustment layers on just the mosaic half of the image (excluding the Hald LUT) and see a superposition of all the histograms of all the frames. This amount of representative data from all the frames makes automatic color correction algorithms very happy! Once I’m done with my adjustments (automatic or manual), I have a little action/macro that drops the adjustment layer mask so the changes are applied to the entire image, this time including the Hald LUT. Once I’m done tinkering, I can save just Hald LUT off. This can be used directly with automated tools like ImageMagick to apply the same transformation to all of the full-size frames.

I suspect your synthetic color chart method would work excellently on one of those big mosaics because of all the additional min/max color bound data!

3 Likes

Very interesting idea of a film histogram.

The synthetic chart method is quite simple, so it has the limitation that it uses the three minimums and three maximums (for each color channel RGB in the area of interest), so in the case of the film histogram it would pick whatever scene had the darkest/lightest color points.

I did experiment on a film that had constant and strong fading variations of yellow die, and in that case the color chart was imprinted beside the image on every frame, allowing frame by frame color match… it was more of a science project, because one ends up with frame-by-frame color correction.

What is interesting of the 3minmax is that it looks at the content corrections, not just the fading corrections. It is not uncommon on old films to have mixed light, and sometimes is just the panning of the camera from the natural light to the tungsten that would require a change in color correction.

I was actually thinking of using these min/max primaries in the AOI values to do a color-scene detection. When the primaries change dramatically consider it a new scene (color-scene). The transition point would create its side-card-color-chart.