Here is the third post in the series - some experiments on how digitial cameras see the world. In part1, we discussed the two major components of color perception, spectra of light sources and spectra of object surfaces. The spectra of light sources typically have a parameter called correlated color temperature, which can vary between very warm light (low cct) and very cold light (high cct). Luckily, spectra of object surfaces stay constant over time. In part2, the amazing property of human color vision to (mostly) disregard the variations of the light source and deliver the pure object color was discussed. That property of human color vision finds its limit mostly only with certain artifical illumination, either flourescent light or narrowband LED illumination.
Not too surprisingly, digital cameras employ similar processing steps to get close to the performance of human color vision. Let’s see how this is done.
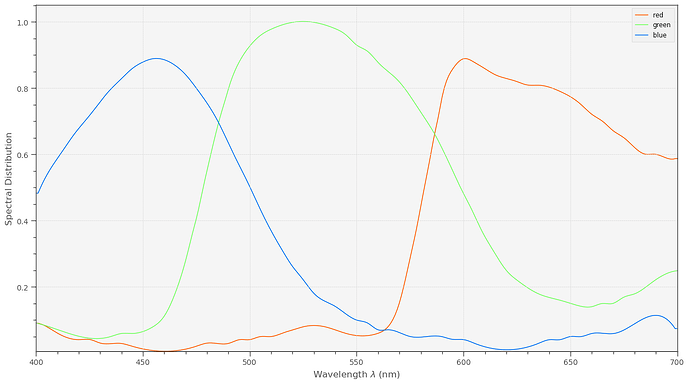
Like humans, cameras have three color channels. We will base our discussion/examples on the IMX477, the sensor which is utilized in the HQ camera. The IMX477 features a standard Bayer-filter in front of the pixels; the spectral sensitivity curves are shown here:
The color of the curves is actually an approximation of the colors of the filters - if one would be able to look through these tiny patches of color.
Some remarks are important at that point. Note how broad and overlapping the sensitivity curves are. That is similar to the “filter” curves of human color vision and technically important for the task at hand: derive from a continious function (the spectrum) a small set of parameters (3 color values) which describe the spectrum best. In fact, Bayer-filter are optimized within the context of what is physically/chemically possible to make the camera response as close as possible to human observers.
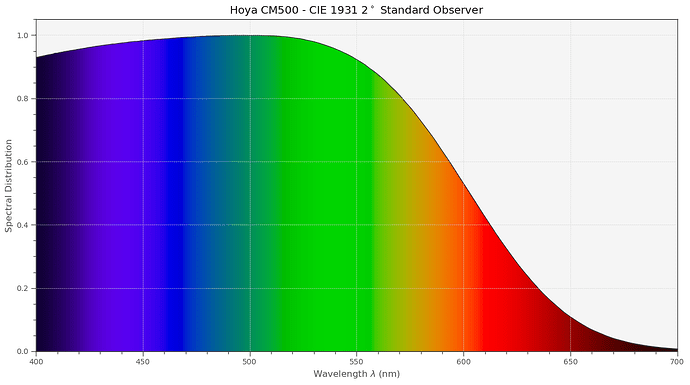
Another thing I want to point out is that in the extreme red region (above 660 nm) the green and blue filters become transparent again. In fact, if we would go further out (above 720 nm or so), all filter curves would become very similar, unable to yield any color information. This is not only with the IMX477 so, but with basically every other digital camera. That’s the reason for the IR-blockfilter one finds in basically any digital camera (or IR/UV-blockfilter). Here’s the filter curve of one of the two types of IR-blockfilter used in the HQ camera (earlier HQ cams used the Hoya-Filter, later models a slightly different one):
Surprisingly, the “IR-blockfilter” of the HQ camera does not only block IR-radiation, but also quite a wide band of other colors. Whether this choice is a commercial optimization or whether this helps with the color science of the sensor I currently do not know.
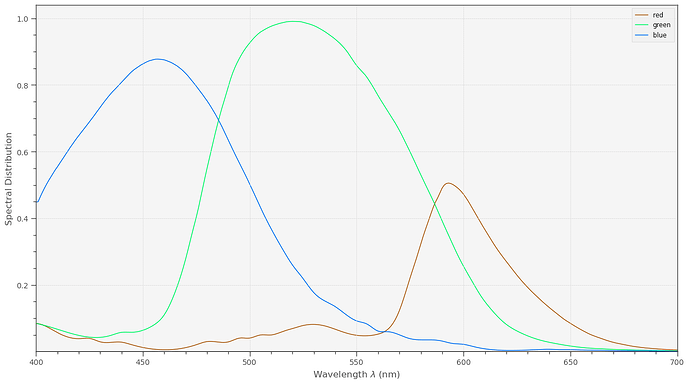
In any case, including the Hoya-filter into the signal path, we finally arrive at the sensitivity curves for the HQ sensor:
This is the data the scientific tuning file for the HQ sensor is based upon. Note how small the red component is in comparision with the other color channels. That is the main reason why red gain settings usually hover around 3.0, blue gains around 2.0, while the green gain is constant at 1.0.
Anyway. Folding these filter spectra with the combined illumination and surface spectra in a given scene yields immediately three numbers: the raw image which can be saved as a .dng-file via libcamera/picamera2. The .dng-file will however contain metadata which will normally be used by whatever program you use for “developing” the raw. Most specifically, an “As Shot Neutral”-tag which describes the characteristics of the scene’s illumination, and (in the case of libcamera/picamera2) a “Color Matrix 1”-tag, which describes the transformation from camera RGB-values into an appropriate standard color space.
A small insert is in order here: in the case of libcamera/picamera2, the “As Shot Neutral”-tag and the “Color Matrix 1”-tag embeded in the .dng depend on the tuning file used. So even if you are working directly with raw dng.-files, make sure to use the correct tuning file. The colors you are going to see when opening the raw will be defined by this data!
Ok, coming back to the way a digital camera sees the world. We already know on how to arrive at the raw image intensities. Usually, in a raw image, everything looks kind of greenish. Specifically, grey surfaces are certainly not grey. To achieve this, a whitebalancing step is next. This whitebalancing step is equivalent to the chromatic adaption discussed in the human color vision part of the series and gets rid of the influence of the scene’s illumination (most of the time).
In case an AWB-algorithm is active, that AWB-algorithm will try to estimate a correlated color temperature (cct) of the scene. This is in fact a very rough characterisation of the scene’s illumination, as we have discussed before.
Once the cct of the light source has been estimated, appropriate red and blue gains (green gain is always 1.0) are computed and applied to the raw image. How this computation is done is written down in the tuning file of the HQ sensor.
If manual gains for the red and blue channel are set, the cct of the scene’s illumination are computed from them - again, these computations are based on information stored in the tuning file.
Ideally, once whitebalancing is performed, we arrive at an image were grey surfaces are grey. But usually, this image (I call it in the following camera RGB) looks rather unsaturated. Certainly, the colors are not yet correct.
This is rectified in the next step, were the camera RGB values are mapped into a defined output color space, say sRGB for example. To accomplish that, a 3x3 transformation matrix is used. This matrix is usually called compromise color matrix (ccm) and it is indeed a compromise: you cannot map all colors to their correct places all at once. If you want optimal blue colors, your skin colors might suffer and vice versa.
The ccm which is most optimal depends on the color temperature of the scene. So this is what is happening: once the color temperature has been estimated, libcamera/picamera2 looks into the tuning file, were a set of different optimized ccms for various ccts are stored, and interpolates a ccm from the two stored ccms which match the estimated cct best. The ccm computed in that way is actually the matrix stored in the “Color Matrix 1”-tag of the .dng and will be very the matrix used by your external raw developer as well to display your image.
In any case, once that matrix is applied, we should end up with an RGB image in a defined color space.
Since that journey was quite complicated, let me summarize this again:
- Capture of the raw image. Basically, the combined illumination and object surface spectrum is filtered through the Bayer- and IR-blockfilter of the sensor.
- Estimation of the color temperature of the scene. This is done either through AWB-algorithms or by manually setting red and blue gains.
- Whitebalancing the raw image. For this, we need appropriate red and blue gains. We either set them manually or they are computed from the estimated cct. The gains are stored as “As Shot Neutral”-tag in the .dng which will be produced.
- Transformation into a standard color space. For this step, a compromise color matrix is computed, based on a set of ccms in the tuning file and the estimated color temperature from step 2. The ccm computed is stored in the .dng-file as well, as “Color Matrix 1”-tag.
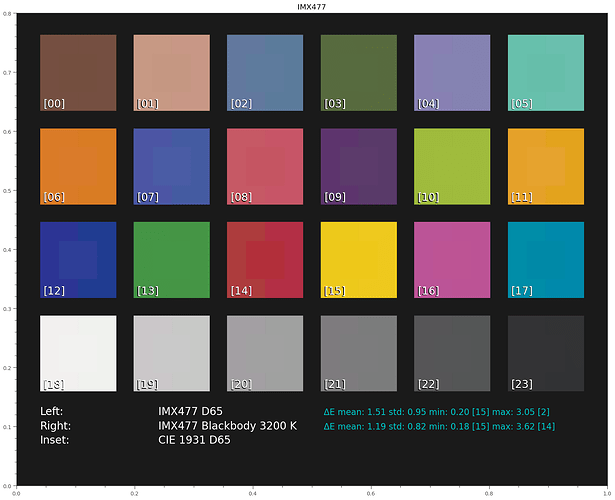
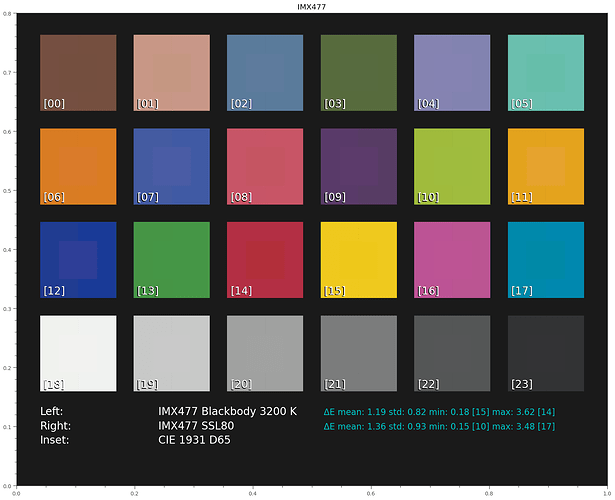
We are now in a position to check how good the HQ sensor combined with the scientific tuning file performs. Here’s the result of a scene illuminated with daylight (“D65”) and with a Tungsten lamp (“Blackbody 3200 K”). Again, the center part of each patch shows how a human observer would see the different patches in daylight:
Well, this result is excellent, at least for a 50€ sensor. By the way, the estimated ccts were 6505.95 K for D65 and 3200.00 K for the blackbody 3200 K light source. Here’s another type of display showing the differences of how a human observer would see a scene vs how the IMX477 combined with the scientific tuning file sees the scene:
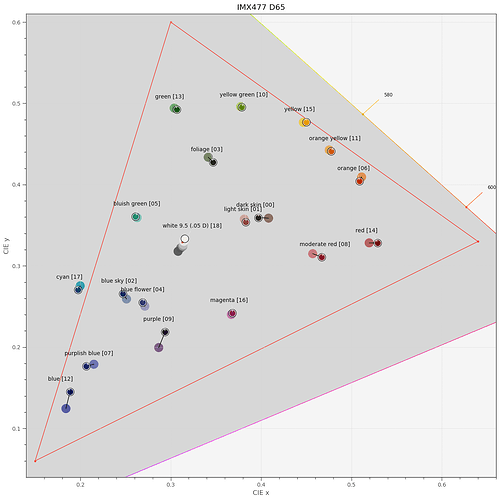
In this diagram, each black circle indicates the color perceived by a human observer, the filled circle shows the position in the xy-diagram of the color the sensor saw. The red triangle indicates the sRGB gamut, note that the cyan patch [17] is outside of this gamut.
Continuing our journey, let’s see how a wideband LED illumination (Osram SSL80, CRI 97.3 (of the published spectrum, not measured. The real one will be lower…, for details see part1 ) works:
We would get the results on the left (“Blackbody 3200K”) with a standard Tungsten lamp, similar to the type used in the old consumer projection systems. On the right side, the wideband LED results are displayed. Again, the color match between a human observer and both of these illuminations is excellent.
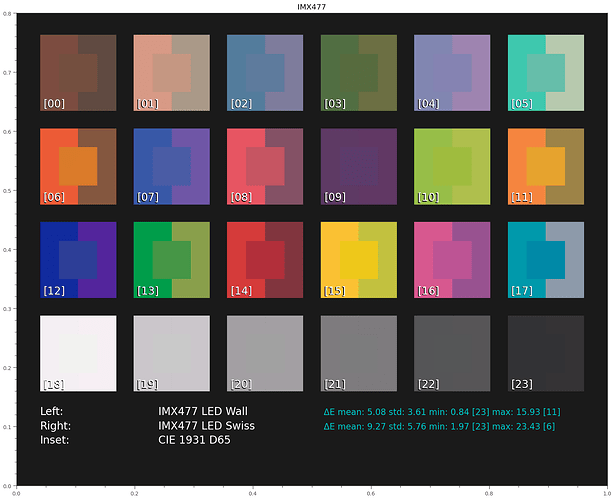
Now we are in a position to examine what narrowband LED illumination would achieve. Remember - this is a simulation where a virtual HQ sensor is looking at a color checker, driven by the scientific tuning file. The color checker is made out of different color pigments and is illuminated by various light sources. This is not the simulation we are actually interested in: a film transparency composed of magenta, cyan and yellow dye clouds, illuminated from behind by an appropriate light source. I do not yet have such a simulation setup.
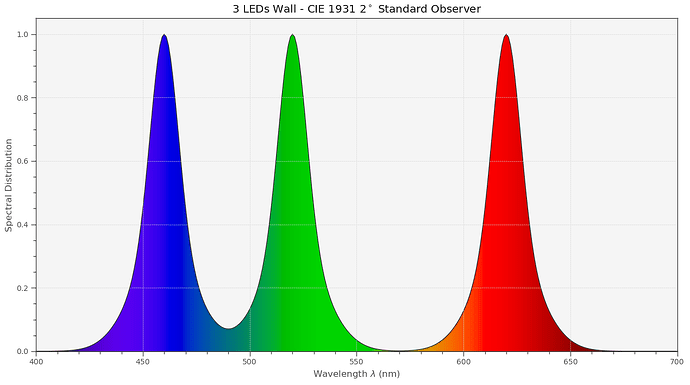
Anyway. Let’s see how two different narrowband LED setups are performing. One is the “LED Wall” setup introduced before,
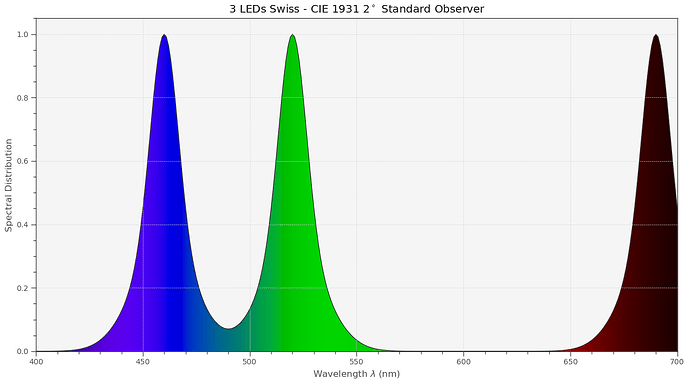
the other one is the setup which was suggested in the DIASTOR paper:
There’s obviously a large difference between these spectra. Specifically, in the Swiss case, there’s no signal energy at all between about 560 nm to 660 nm - where the orange tones are located.
Simultating this setup, we get the following result:
Not so good. While the cct for the LED Wall was computed as 6621.94 K, the cct of the Swiss LED ended up as 8600.00 K - which is just an indication that this not really a natural spectrum.
Note the failures especially of the Swiss setup in the orange tones, as expected.
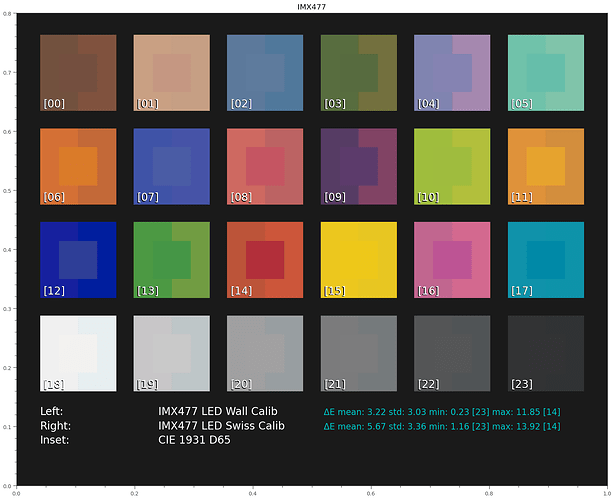
As already remarked, in case of digital cameras we have yet another option available: a direct optimization of the ccm via calibration, bypassing the ccms of libcamera and its tuning file.
(disclaimer: my optimization is not fine-tuned in any direction. And it uses only a 3x3-matrix - more advanced features are possible).
Let’s see how this works out:
Ok, we see an improvement, as promised. So this is obviously also a way to go. I do see issues in any of spectal ranges were the narrowband setup does not deliver enough energy. In the examples above, mainly in the orange-red range.
While we can improve the result of narrowband illumination by direct calibration, the low signals we end up working with in such badly illuminated bands are probably leading to increased noise characteristics for these colors.
In closing, let me note again that the experiments above are simulating a color checker with patches composed of various pigments, illuminated by various light sources, and “seen” by a HQ camera sensor. That is sort of similar to the setup we are actually after, namely a film frame illuminated from the back with a specific illumination. But I do see an important difference: the pigments of the color checker have probably different spectra lcharacteristics than film dyes. I am trying to develop such a simulation, but I am not there yet.
