Narrowband cameras aren’t “most cameras”. These tools exist specifically for this type of situation.
The following is all real-world data:
Last September I meticulously scanned a 35mm Ektachrome Wolf Faust calibration target (manufactured in 2016) using the same light, lens, and exposure setup that I plan to use with real film (which, incidentally, my backlog is ~50% Ektachrome so I won’t have to worry as much about metameric failure on that half).
This is from a monochrome Sony IMX429 sensor (the Lucid Triton 2.8 MP, model TRI028S-MC).
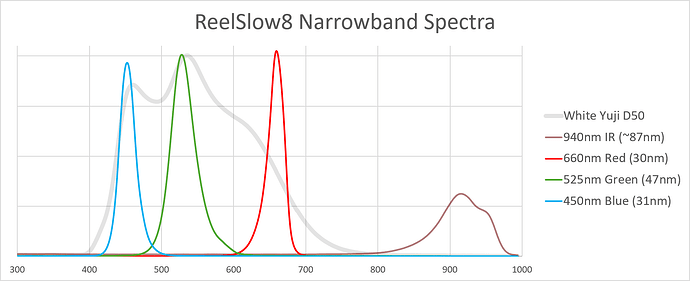
I just used an ASEQ Instruments LR1 spectrometer to measure the light spectra from my narrowband integration sphere. Placing the spectrometer probe right at the exit pupil of the sphere and lighting each channel in turn, I obtained the following. (Y-axis is arbitrary):
The spectrometer’s software can try to fit a gaussian to a peak. The numbers in parenthesis in the legend are the estimated width of each peak. The measured peaks seem to be pulled off to the side a little by the edge “tilt” of the frequency spike:
| Color | Part no. | stated | measured |
|---|---|---|---|
| White | Yuji D50 High CRI LED | D50 | |
| IR | Luminus_SST-10-IRD-B90H-S940 | 940 nm | 915.3 nm |
| Red | Luminus SST-10-DR-B90-H660 | 660 nm | 659.5 nm |
| Green | Cree XPCGRN-L1-0000-00702 | 525 nm | 528.2 nm |
| Blue | Luminus SST-10-B-B90-P450 | 450 nm | 452.4 nm |
Using the latest (3.2.0) version of the free Argyll CMS tools, you can grab the averaged RGB triples from a 16-bit TIFF of an IT8 target and pair it with its reference XYZ colorimetric data using the scanin app, which outputs a .ti3 file.
With the boiled-down .ti3 file (288 pairs of XYZ and RGB triples) you can generate all sorts of ICC color profiles using the colprof tool.
Finally, they were so kind to include profcheck which runs exactly this Delta E analysis against the original image using the newly generated ICC profile.
So, using a single TIFF I was able to generate three different ICC profiles (using the “high” quality mode out of { low, medium, high, ultra }) containing:
- 3x3 matrix-only.
- 3x3 matrix + “shaper” (which is a 1D gamma LUT for each channel)
- XYZ cLUT
I believe the first matrix-only profile corresponds most closely of the three to your “3 LEDs Swiss” simulation above.
Running profcheck gave the following Delta E results against the original TIFF:
| Max error | Avg error | RMS | |
|---|---|---|---|
| Matrix-only (high) | 27.940950 | 5.451902 | 7.405225 |
| Matrix+shaper (high) | 26.187890 | 4.564698 | 6.461728 |
| XYZ cLUT (high) | 3.879810 | 0.312821 | 0.604227 |
| XYZ cLUT (ultra) | 2.921067 | 0.271423 | 0.517082 |
The middle column is the interesting one. The XYZ cLUT profile gives better than a full order of magnitude improved error over a profile with just a matrix!
(You can squeeze a little more out by using the “ultra” quality preset, but over-fitting is going to happen and it takes 30+ minutes to generate. I included that row only anecdotally.)
On top of the summary, profcheck can give you the full list of color patches with the Delta E for each ordered from bad-to-good. Out of 288 patches, only a single red square (L17) from the cLUT profile was >3.0 and only another six patches had an error between 2.0 and 3.0.
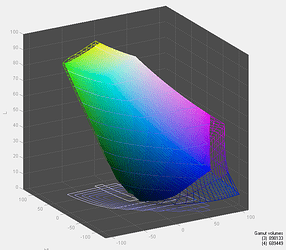
Here, the matrix-only result is shown in wireframe-3D. The filled volume is sRGB. A matrix only linearly stretches the color space:
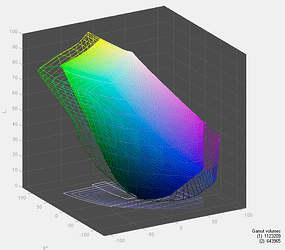
With a LUT you can arbitrarily re-shape it:
Here is the raw data with the list of command-line steps used to generate the profiles if you’d like to experiment with it: TIFF and reference data. Just drop the contents in Argyll’s “bin” folder and follow the instructions in the “argyll steps” text file.
Of course these numbers aren’t directly comparable to your simulation. I believe the under-the-hood illuminant is D50, there is a bunch of grain noise in the real slide, the sensor response is different, the sensor is monochrome, my LEDs are wider than 20nm and peak at different wavelengths, the IT8 target was already ~8 years old before I scanned it so it may have already begun to fade slightly, etc. It’s apples and oranges for sure.
I also can’t make a direct comparison to broadband cameras with this monochrome sensor without re-scanning the IT8 target while manually swapping in the separate R, G, and B Wratten color reproduction filters (as seen in my profile picture) between exposures… which would be something like 6 hours of effort to capture the many sections of the 35mm calibration slide using only my 8mm viewport. ![]()
But with any luck this demonstration buries the notion that you don’t need the LUT. It’s the LUT that makes narrowband scanning reasonable. It’s such a powerful and accessible technique that it should be used with broadband film scanning, too. It should never not be used. ![]()


